Average Mile Time by Age and Gender
The average mile time has no overall figure; in 2025 mile races the median for runners in their 30s was 6:38 for men, 8:52 for women (Brian Rock, Outside Run). Strava's 2024 median of 10:15 min/mile across all users' runs is slower because it is an everyday training pace, not a mile race.
· Sources: Brian Rock, Outside Run, 24,640 one-mile race finishers from 2025 races, Athlinks plus the Fifth Avenue Mile (June 2026); Strava's Year in Sport 2024, as reported by The Running Channel (December 2024); WMA/USATF 2025 road age-grading tables
Where does your time land?
Age-graded mile times for every age
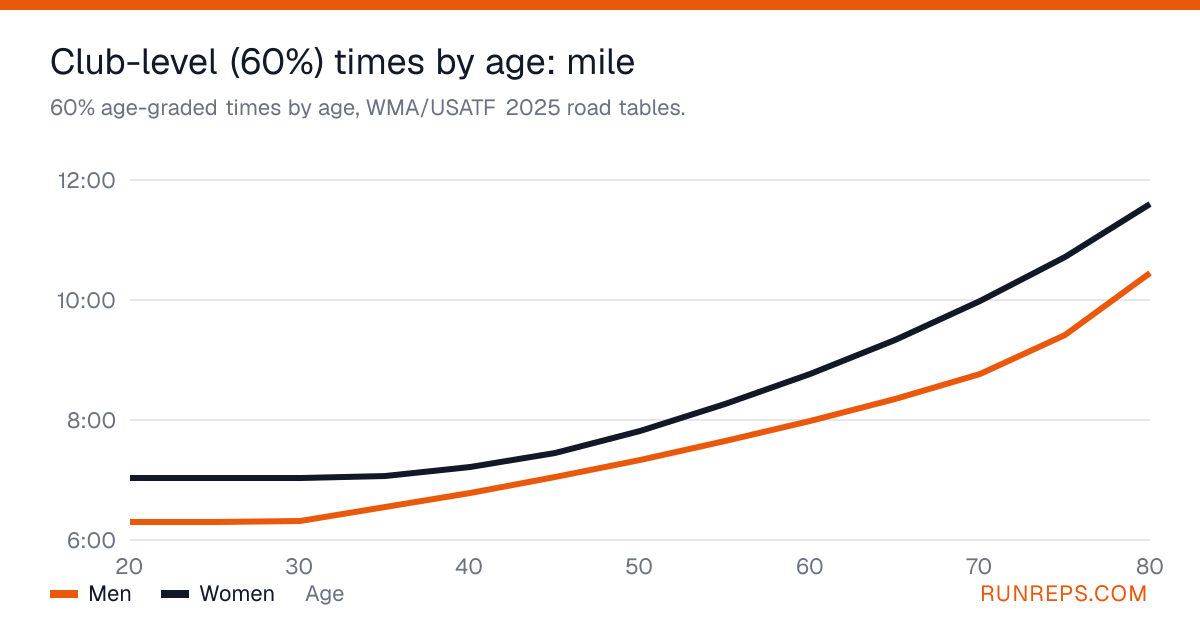
At 40, a 60% age-graded mile, the level the RunReps Age-Grade Calculator calls club level, is 6:47 for men and 7:13 for women.
| Age | 50% | 60% club level | 70% regional class | 80% national class |
|---|---|---|---|---|
| 12 | 8:35 | 7:09 | 6:08 | 5:22 |
| 14 | 8:08 | 6:47 | 5:49 | 5:05 |
| 16 | 7:50 | 6:32 | 5:36 | 4:54 |
| 18 | 7:36 | 6:20 | 5:26 | 4:45 |
| 20 | 7:34 | 6:18 | 5:24 | 4:44 |
| 25 | 7:34 | 6:18 | 5:24 | 4:44 |
| 30 | 7:35 | 6:19 | 5:25 | 4:44 |
| 35 | 7:51 | 6:33 | 5:37 | 4:54 |
| 40 | 8:09 | 6:47 | 5:49 | 5:05 |
| 45 | 8:28 | 7:03 | 6:03 | 5:17 |
| 50 | 8:48 | 7:20 | 6:17 | 5:30 |
| 55 | 9:10 | 7:39 | 6:33 | 5:44 |
| 60 | 9:35 | 7:59 | 6:50 | 5:59 |
| 65 | 10:01 | 8:21 | 7:09 | 6:16 |
| 70 | 10:31 | 8:46 | 7:31 | 6:34 |
| 75 | 11:18 | 9:25 | 8:04 | 7:03 |
| 80 | 12:33 | 10:27 | 8:58 | 7:50 |
| Age | 50% | 60% club level | 70% regional class | 80% national class |
|---|---|---|---|---|
| 12 | 9:24 | 7:50 | 6:43 | 5:52 |
| 14 | 9:01 | 7:31 | 6:26 | 5:38 |
| 16 | 8:43 | 7:16 | 6:13 | 5:27 |
| 18 | 8:28 | 7:03 | 6:03 | 5:18 |
| 20 | 8:26 | 7:02 | 6:01 | 5:16 |
| 25 | 8:26 | 7:02 | 6:01 | 5:16 |
| 30 | 8:26 | 7:02 | 6:01 | 5:16 |
| 35 | 8:29 | 7:04 | 6:04 | 5:18 |
| 40 | 8:39 | 7:13 | 6:11 | 5:24 |
| 45 | 8:57 | 7:27 | 6:23 | 5:35 |
| 50 | 9:23 | 7:49 | 6:42 | 5:52 |
| 55 | 9:55 | 8:16 | 7:05 | 6:12 |
| 60 | 10:31 | 8:46 | 7:31 | 6:35 |
| 65 | 11:12 | 9:20 | 8:00 | 7:00 |
| 70 | 11:58 | 9:59 | 8:33 | 7:29 |
| 75 | 12:52 | 10:43 | 9:11 | 8:02 |
| 80 | 13:55 | 11:36 | 9:56 | 8:42 |
How these mile times are worked out
Every time in the table comes from the WMA/USATF 2025 road age-grading tables, approved by the USATF Masters Long Distance Running Council in January 2025. A percentage grade compares your time with the tables' standard for your age and sex. The 100% mark is the open-class standard, 3:47 for men and 4:13 for women, and the time at any grade is the age standard divided by the grade.
These are targets by age, not averages of real finishers. The rows for ages 12, 14, 16 and 18 come from the tables' youth factors, so they are age-graded benchmarks, not what teenagers typically run. The same tables power the RunReps age-grade calculator.
What is a good mile time?
A good mile time at age 25 is 6:18 for men and 7:02 for women, a 60% age-graded time, the level the RunReps Age-Grade Calculator calls club level on the WMA 2025 road tables. Mile time by age shifts slowly at first: by 40 the same grade is 6:47 for men and 7:13 for women, and by 60 it is 7:59 and 8:46.
Each column has a name: after the unnamed 50% column come 60% club level, 70% regional class and 80% national class, with 90% or more world class. At the top, the tables' 100% mark is 3:47 for men and 4:13 for women, which sits close to the world records.
Why do average mile times disagree?
Average mile times disagree because they measure different things: Brian Rock's Outside Run data covers 24,640 people who raced a mile in 2025, while Strava's 10:15 min/mile is the 2024 median pace across all users' runs, an everyday training pace.
The race sample is fast because it is self-selected: the author says it is smaller and less representative, made up of people who choose to race a mile. Men's medians in that data were 6:09 at 20-29, 6:38 at 30-39, 7:26 at 40-49, 7:38 at 50-59 and 8:48 at 60 and over.
Strava's 10:15 min/mile, or 6:22 min/km, describes how people train, not how fast they race. To find the pace a target mile time needs, use the pace calculator.
What is the average mile time for a woman?
The average mile time for a woman has no overall figure, but among women who race a mile, the median for women in their 30s was 8:52 in 2025 races, according to Brian Rock at Outside Run.
By age group, the women's medians were 7:51 at 20-29, 8:52 at 30-39, 9:50 at 40-49, 10:05 at 50-59 and 11:48 at 60 and over.
For an age-graded yardstick, 7:02 at 25 and 7:13 at 40 are 60% times for women, the level the RunReps Age-Grade Calculator calls club level. If you race further too, set your result against the average 5K time.
Is an 8 minute mile good?
An 8 minute mile is a respectable race result that grades higher with age: on the WMA 2025 road tables it scores 52.7% for a woman aged 25, past a 50% age grade, and 62.0%, club level, for a woman aged 55.
For men it scores 47.3% at 25, just under a 50% age grade, and 62.6%, club level, at 65. As a training pace, 8:00 min/mile is quicker than Strava's 2024 median of 10:15 min/mile across all users' runs.
Is a 10 minute mile good?
A 10 minute mile is a typical everyday training pace: it sits close to Strava's 2024 median of 10:15 min/mile across all users' runs, while as a race it scores 37.8%, below a 50% age grade, for a man aged 25 on the WMA 2025 road tables.
Age changes the verdict. A 10:00 mile scores 50.1% for a man aged 65, a 50% age grade, and 64.3%, club level, for a woman aged 75, so for older runners it is a genuine race result.
What is a good mile time for a 14-year-old?
A good mile time for a 14-year-old is 6:47 for boys and 7:31 for girls, a 60% age-graded time, the level the RunReps Age-Grade Calculator calls club level on the WMA 2025 road tables' youth factors.
No large study publishes an average 1 mile run time for 14-year-olds, and these figures are age-graded benchmarks, not what teenagers typically run. The target gets quicker through the teens: a 60% mile is 7:09 for boys at 12 and 6:20 at 18, and 7:50 for girls at 12 and 7:03 at 18. A 14-year-old girl who runs 6:00 scores 75.1%, regional class.
How do you compare with the pros?
Turn your time into a RunReps Score out of 1,000 and see which elite runner you sit closest to.
Calculate Your ScoreReady to move up a band?
A structured plan is the quickest way from one row of the table to the next.
Browse Training PlansQuestions runners ask about mile times
Is a 7 minute mile good?
A 7 minute mile is club level for many runners: on the WMA 2025 road tables it scores 60.2% for a woman aged 25 and 60.4% for a man aged 45. For a man aged 25 it scores 54.0%, past a 50% age grade.
Is a 12 minute mile good?
As a race, a 12 minute mile scores 31.5% for a man aged 25 and 35.1% for a woman aged 25 on the WMA 2025 road tables, and 53.6%, past a 50% age grade, for a woman aged 75. As a training pace it is slower than Strava's 2024 median of 10:15 min/mile across all users' runs.
How fast does the average man run a mile?
No overall figure exists, but among men who race a mile, the median for men in their 30s was 6:38 in 2025 races, according to Brian Rock at Outside Run. Men in their 20s had a median of 6:09, and men aged 60 and over 8:48.
How long does it take to run a mile?
Among runners who race a mile, the 2025 median for runners in their 30s was 6:38 for men and 8:52 for women. At an everyday training pace, Strava's 2024 median across all users' runs was 10:15 min/mile, or 6:22 min/km.
What is a good mile time for my age?
A 60% age-graded time, the level the RunReps Age-Grade Calculator calls club level, is 6:47 for a man aged 40 and 7:13 for a woman aged 40. At 60 it is 7:59 for men and 8:46 for women.
What is a respectable 1 mile time?
A 70% regional-class mile on the WMA 2025 road tables is 5:24 for a man aged 25 and 6:01 for a woman aged 25. At 45 it is 6:03 for men and 6:23 for women.